
Hands-on Lab: Creating Basic Tableau Visualizations
To analyze the sales performance of a retail chain and understand the impact of various factors, you'll need to create several worksheets that break down these components.
Pre-Task Guidelines:
- Use the Getting Started with Tableau and Advanced Data Visualization with Tableau courses for your reference
- You need a free Tableau Public account for this lab. If you haven't already done so, you can sign up for an account using the steps here.
- Although we are using Tableau for this hands-on lab, you can use other data visualization tools to perform these tasks such as IBM Cognos Analytics or Google Looker Studio.
Data:
Use the provided files sales.csv, product_hierarchy.csv, store_cities.csv, store_names.csv, city_names.csv, and product_names.csv.
Hold the CTRL key (or COMMAND key for Mac systems) while you click each file to download it:
Required Software:
You can complete this lab using the free, downloadable Tableau Desktop (Public Edition) desktop software. You may also use the free Tableau Public online platform, but some tasks may not work in exactly the same way or may not be supported in that version.
Although we are using Tableau for this hands-on lab, you can use other data visualization tools to perform these tasks such as IBM Cognos Analytics or Google Looker Studio.
Duration: Estimated time needed 60 minutes
Tasks:
1. Import csv files to Tableau
- Connect to a data source and import all of the provided files into Tableau
- Take a screenshot
2. Establish relationships between data source tables
- Create relationships between tables in the data source as per the image below
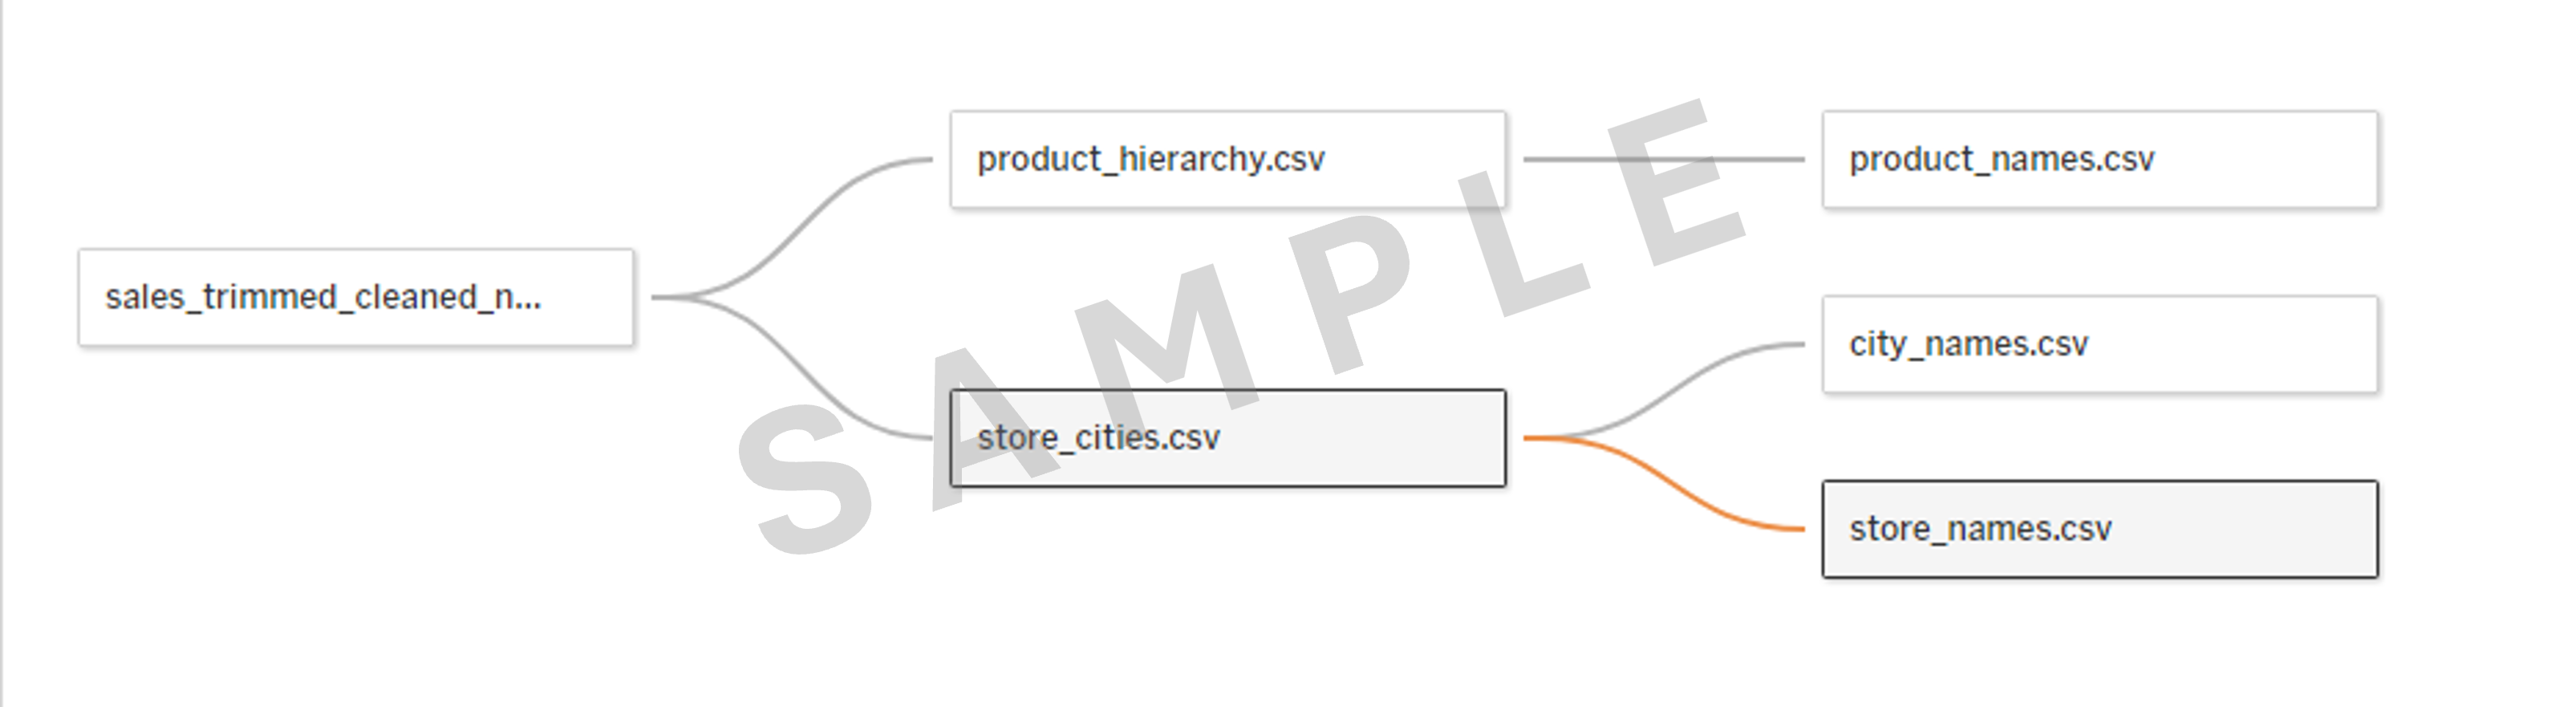
- Verify the Cardinality and Related Fields for the relationship between store_cities.csv and store_names.csv
- Take a screenshot
3. Create calculated fields
- Create a calculated field to display Sales Growth Percentage
Hint
(SUM([Sales]) - LOOKUP(SUM([Sales]), -1)) / LOOKUP(SUM([Sales]), -1)
- Create a calculated field to display Average Stock Levels
Hint
AVG([Stock])
- Take a screenshot
4. Create visualizations
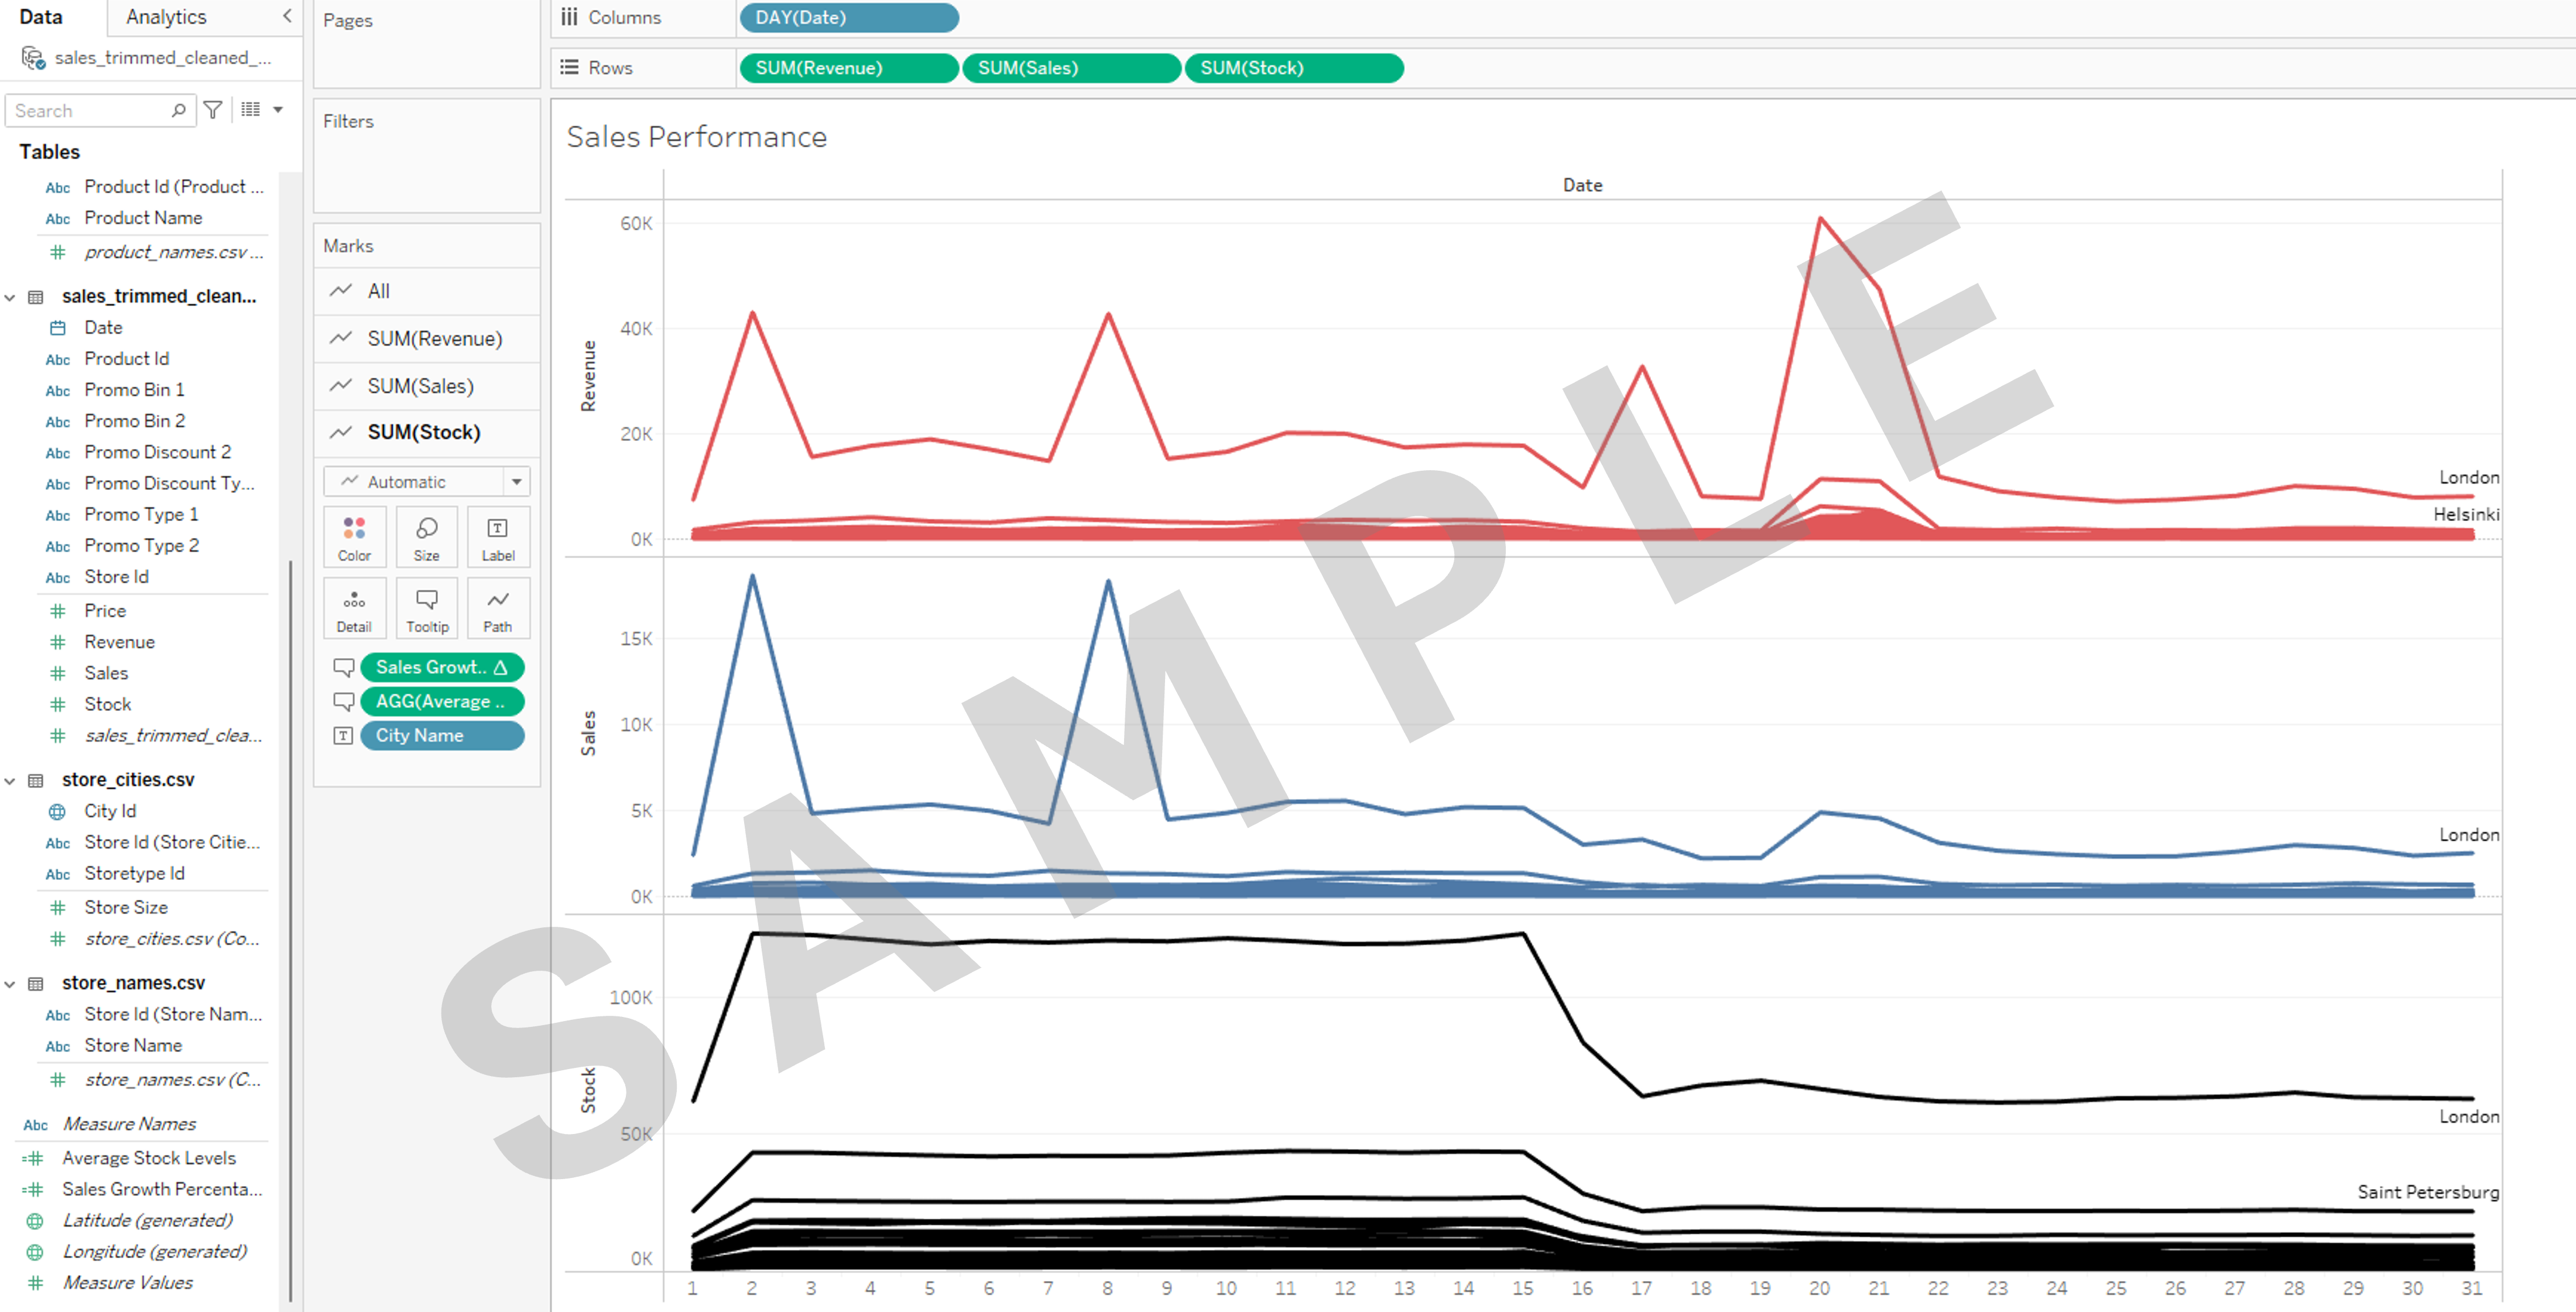
- Create a worksheet containing a visualization called Sales Performance with the following characteristics:
- Line chart
- Displaying all cities
- Displaying values by Date using Day as the setting
- Displaying Total Sales, Total Revenue, and Total Stock
- In the Marks card, change the Color setting of the SUM(Revenue), SUM(Sales), and SUM(Stock) items to 3 different colors
- Add the two calculated fields created in task 3 to the Tooltip section of the Marks card
- Take a screenshot
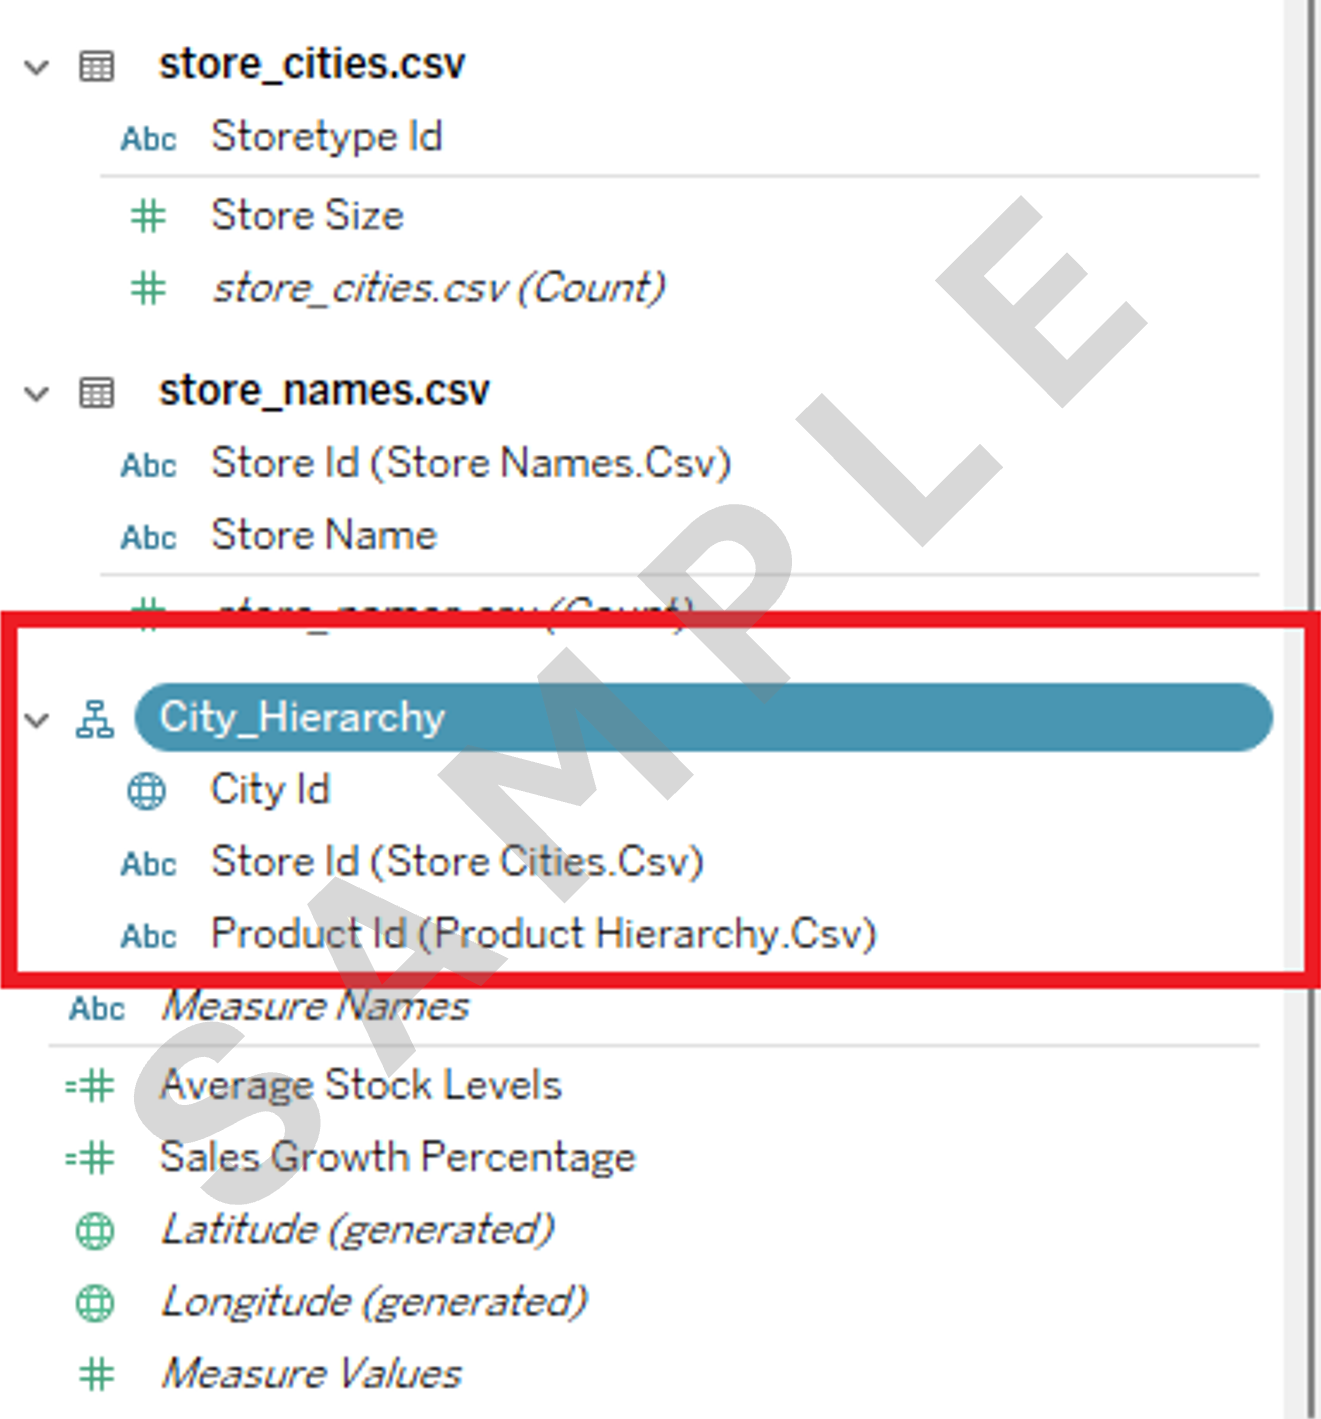
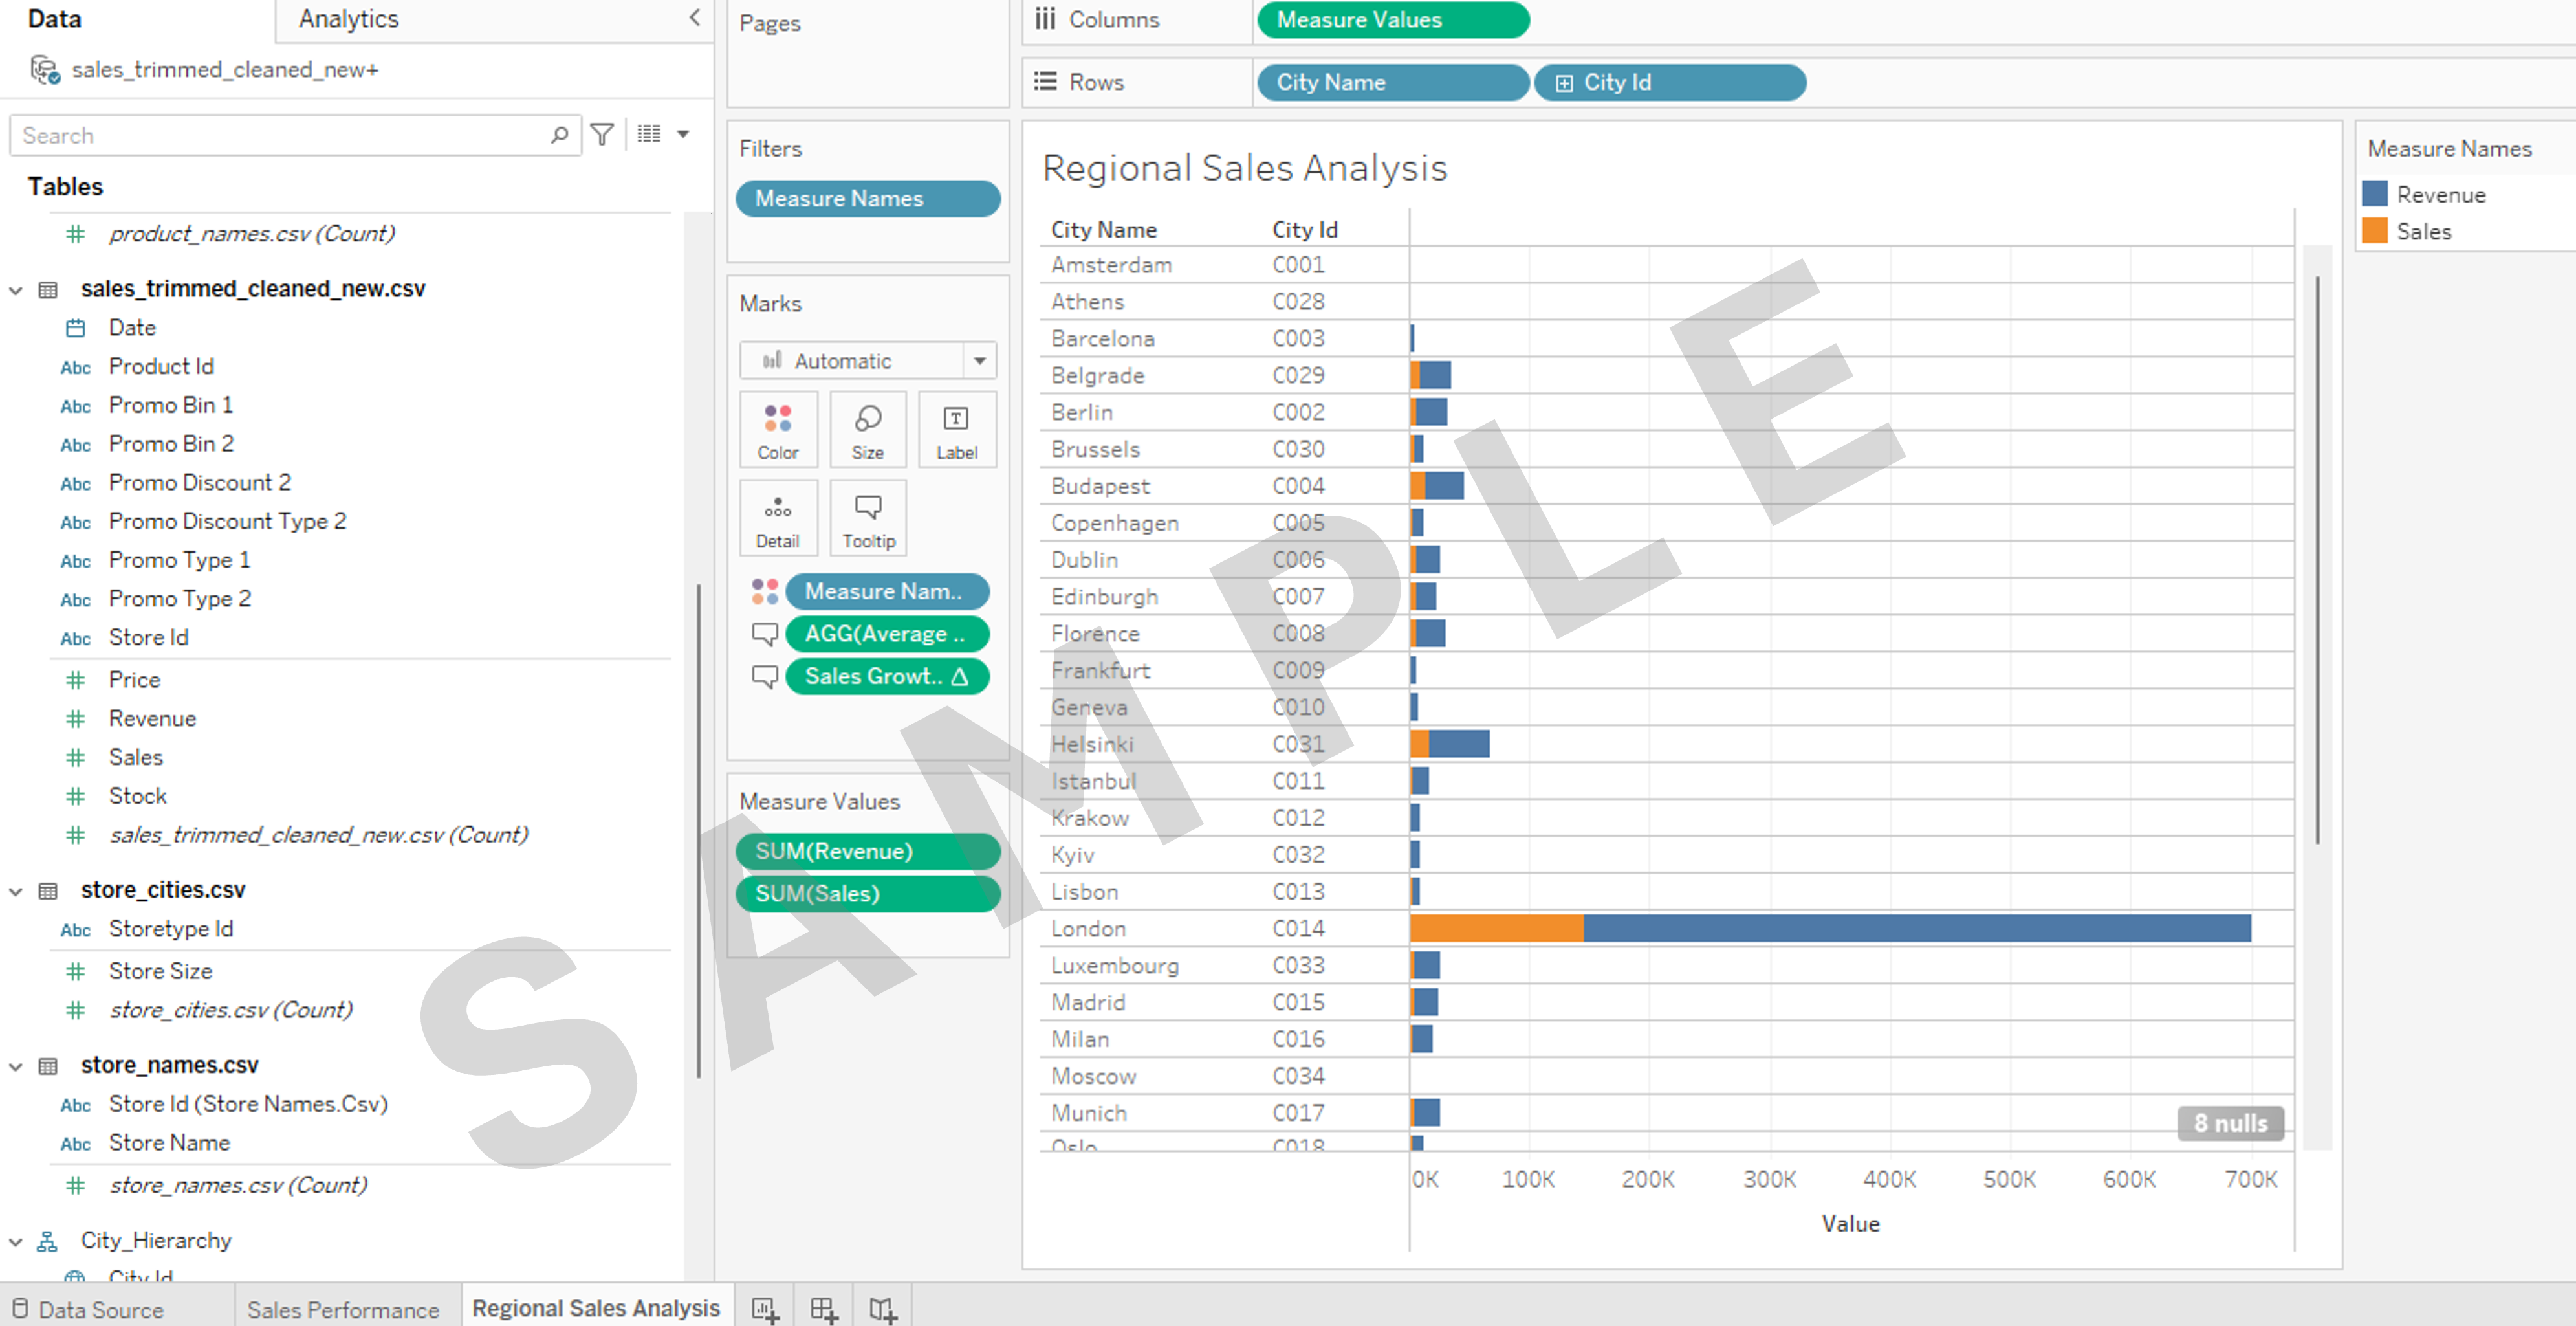
- Create a worksheet containing a visualization called Regional Sales Analysis with the following characteristics:
- Using a hierarchy called City_Hierarchy comprising of City Id then Store Id then Product Id
Hint
- Horizontal bar chart
- Displaying all cities
- Displaying Total Sales and Total Revenue
- Add the two calculated fields created in task 3 to the Tooltip section of the Marks card
- Take a screenshot
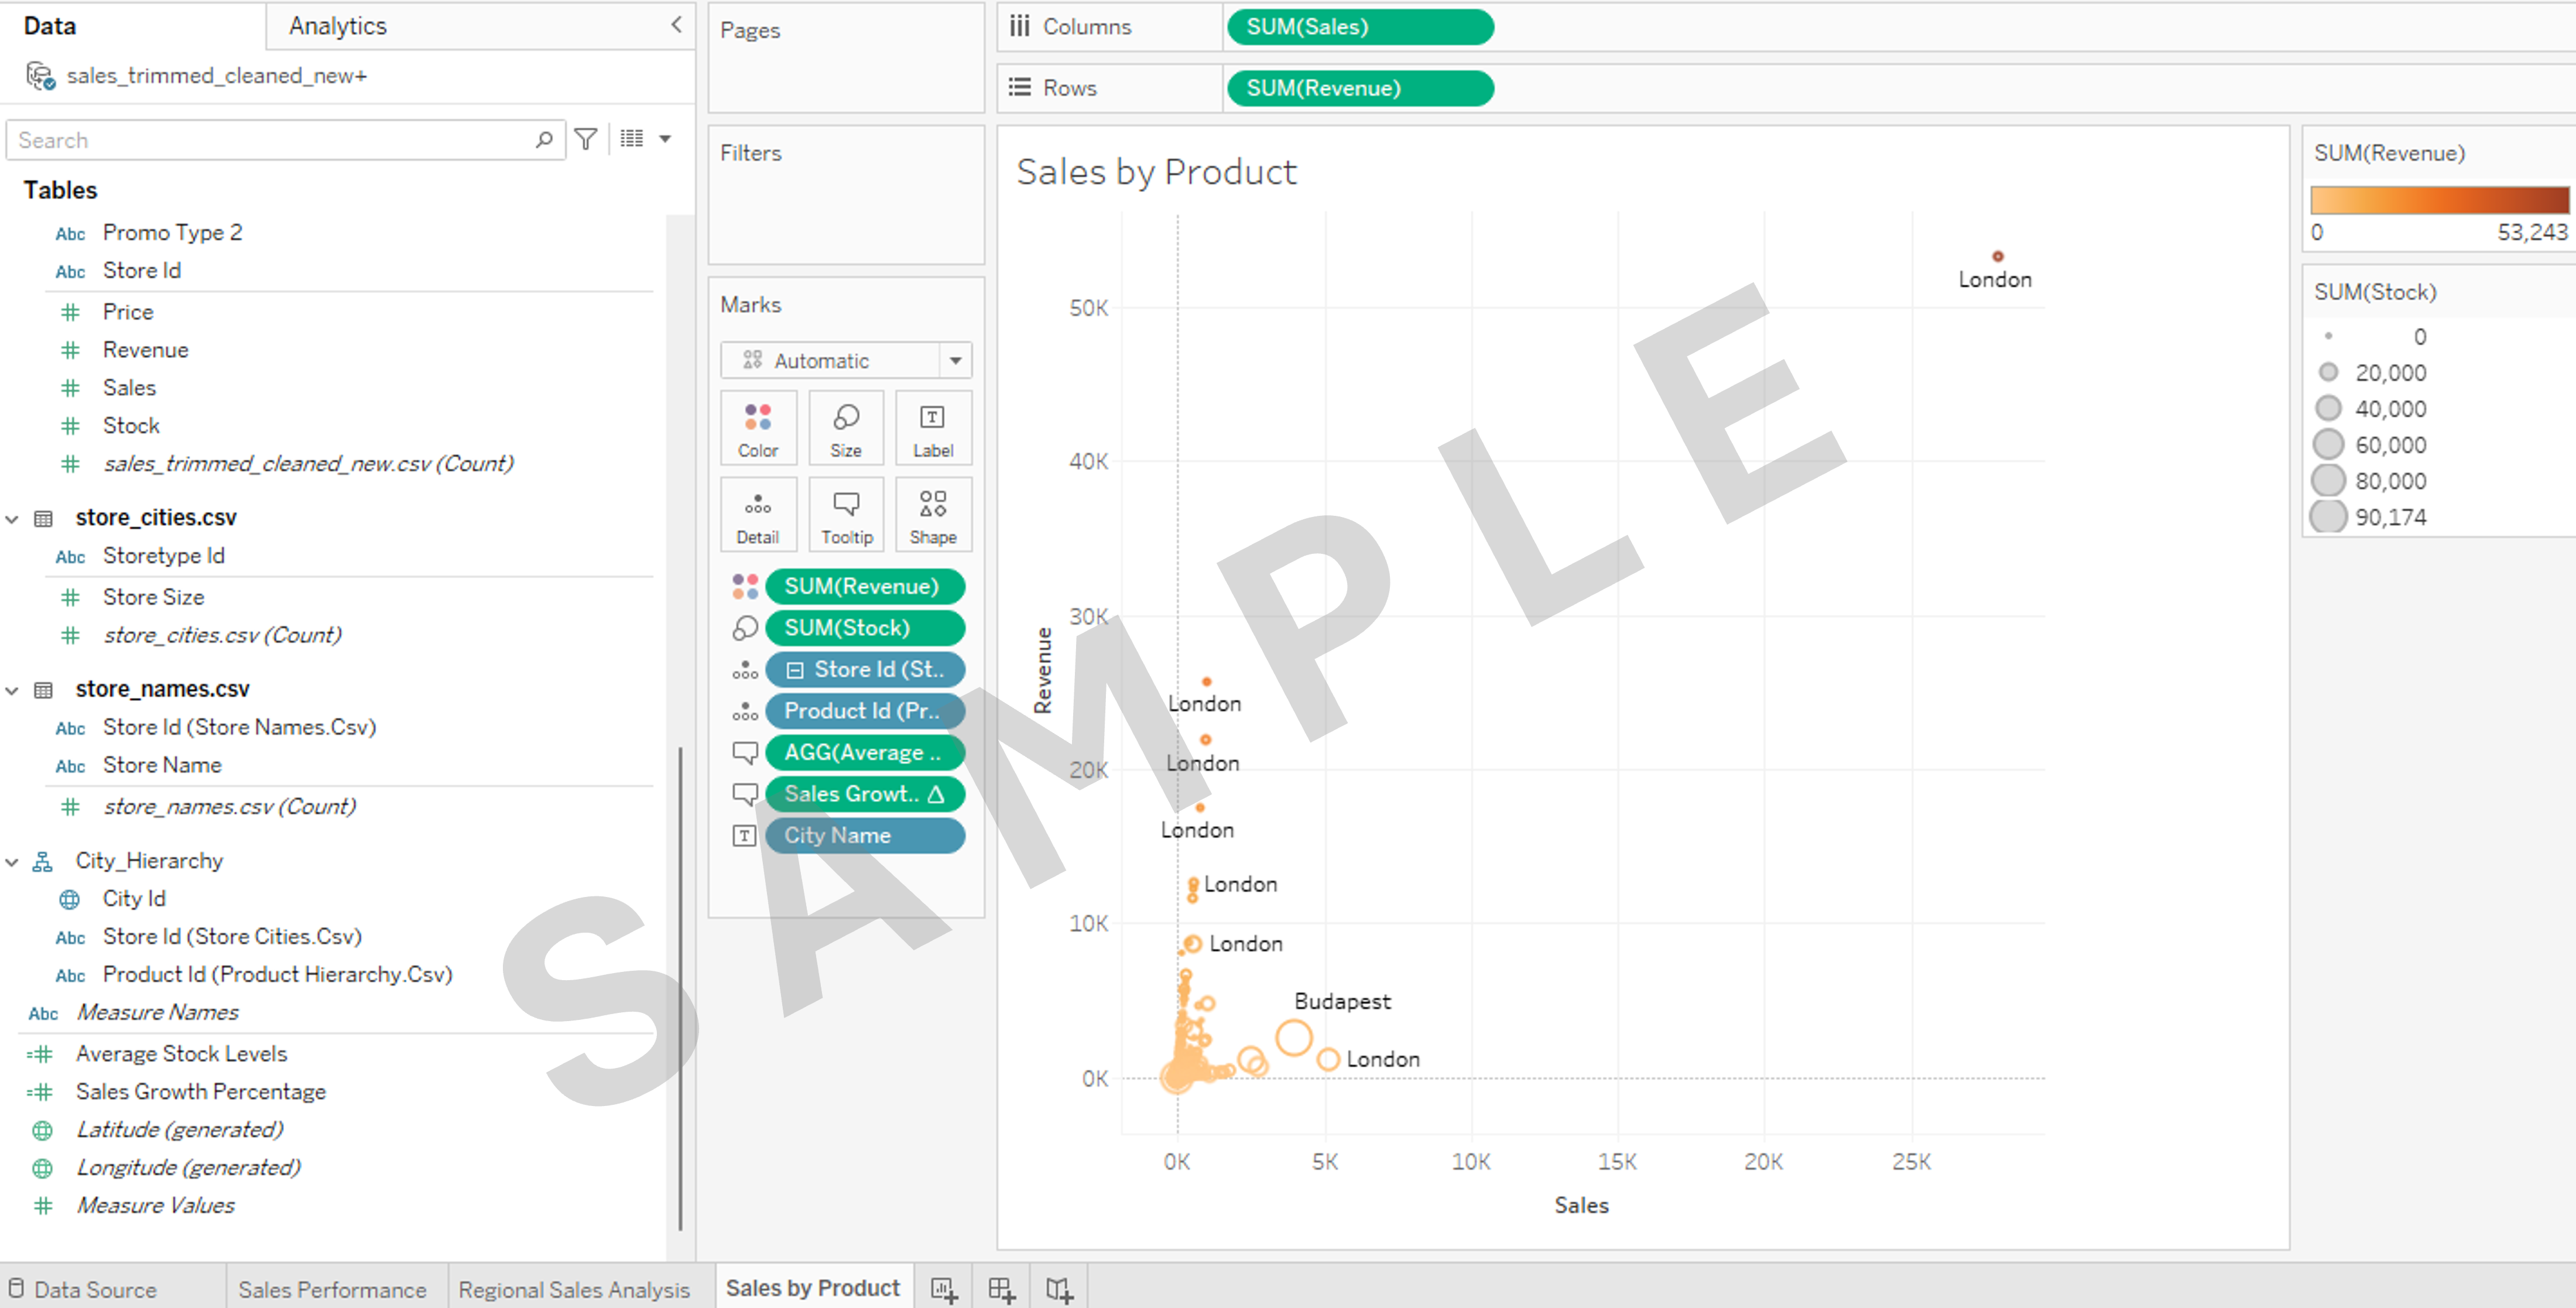
- Create a worksheet containing a visualization called Sales by Product with the following characteristics:
- Scatter plot
- Displaying Total Sales, Total Revenue
- Use Revenue for Color (change to another color using Edit Colors on the SUM(Revenue) legend)
- Use Stocks to show the Size difference
- Use City Name for Labels
- Use Store Id and Product Id from City_Hierarchy to show Detail
- Add the two calculated fields created in task 3 to the Tooltip
- Take a screenshot
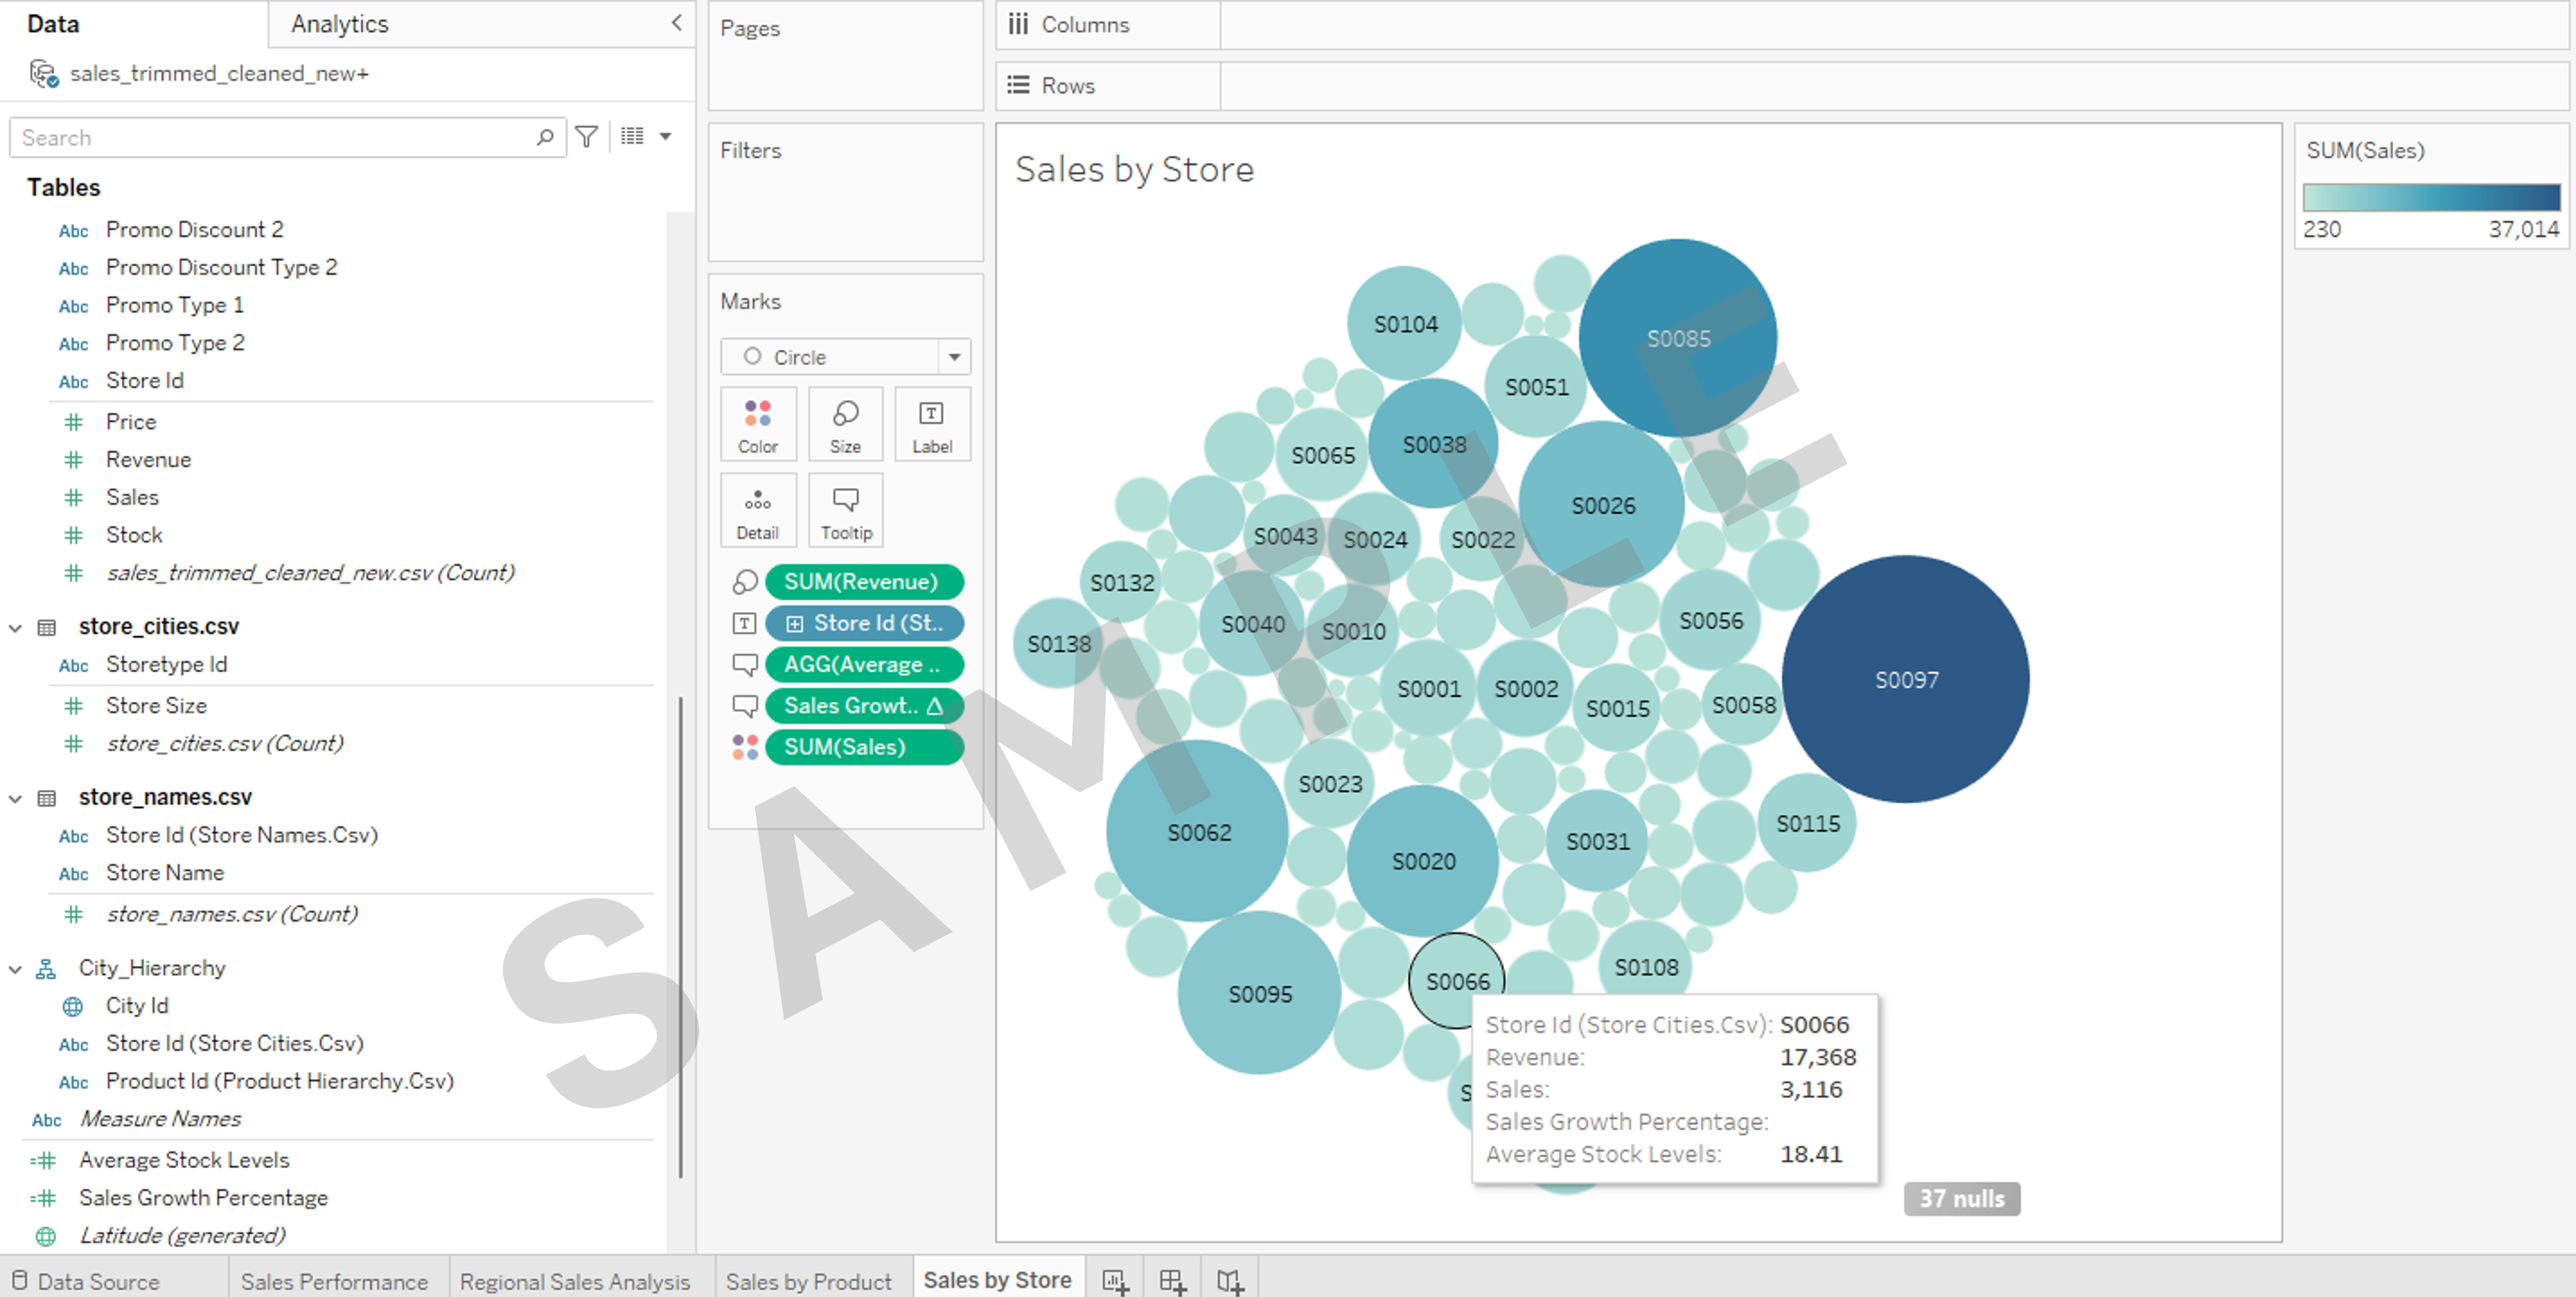
- Create a worksheet containing a visualization called Sales by Store with the following characteristics:
- Packed bubbles chart
- Use Sales for Color
- Use Revenue for Size
- Use Store Id for Labels
- Add the two calculated fields created in task 3 to the Tooltip
- Take a screenshot
5. Save your workbook and take a screenshot
- Save your Tableau workbook as yourname_workbook.
- Ensure you have taken a screenshot of each worksheet, as you'll be required to add them to your final PowerPoint presentation.
Note
By completing these tasks, you'll demonstrate that you have mastered the technical skills needed to manipulate and visualize data in Tableau and gained the ability to extract meaningful insights from complex datasets, a crucial skill in data-driven decision-making processes.
Congratulations! You have completed this lab and are ready for the next topic.
Author(s)
Steve Ryan